Global Trends in Agriculture: Crops and Livestock
INFO 526 - Fall 2023 - Project Final
Jay Patil, Johnson Jeeva John Jacob, Likhith Ramesh, Pragnya Narasimha, Sreeharsha Nalluri, Sumanth Manohar, Tanmay Nalawade
Introduction
- Project Description: This project involves the compilation and analysis of statistical data for 278 crop and livestock products, presented through key indicators such as production quantities, yields, and processed product outputs.
- Impact: The dataset serves as a critical resource for understanding global agricultural production patterns, providing insights into the dynamics of crop and livestock industries and supporting data-driven decision-making in agriculture.
Dataset
- Dataset Description: This report examines the FAOSTAT Crop and Livestock Production dataset, offering comprehensive global agricultural production statistics for over 200 countries.
- Features: It includes data on crop production volumes, harvested areas, yields, and livestock statistics, aiming to analyze agricultural productivity trends, regional outputs, and sustainable agricultural practices. FAO uses estimation methods, ensuring consistency in the data for over 200 countries and regions.
Source: FAO FAOSTAT
Project Approach
- Data Cleaning: We cleaned the dataset by removing rows with missing values in key columns such as Area, Item, and Element to ensure completeness. The cleaned data was then structured with Year and Item as grouping variables, and Value representing total production or harvested area. This preprocessing step enabled focused and accurate analysis of agricultural trends.
- Exploratory Data Analysis (EDA): Uncovered crop production and livestock patterns and trends using statistical methods and visualizations.
Question 1
(General Assessment)
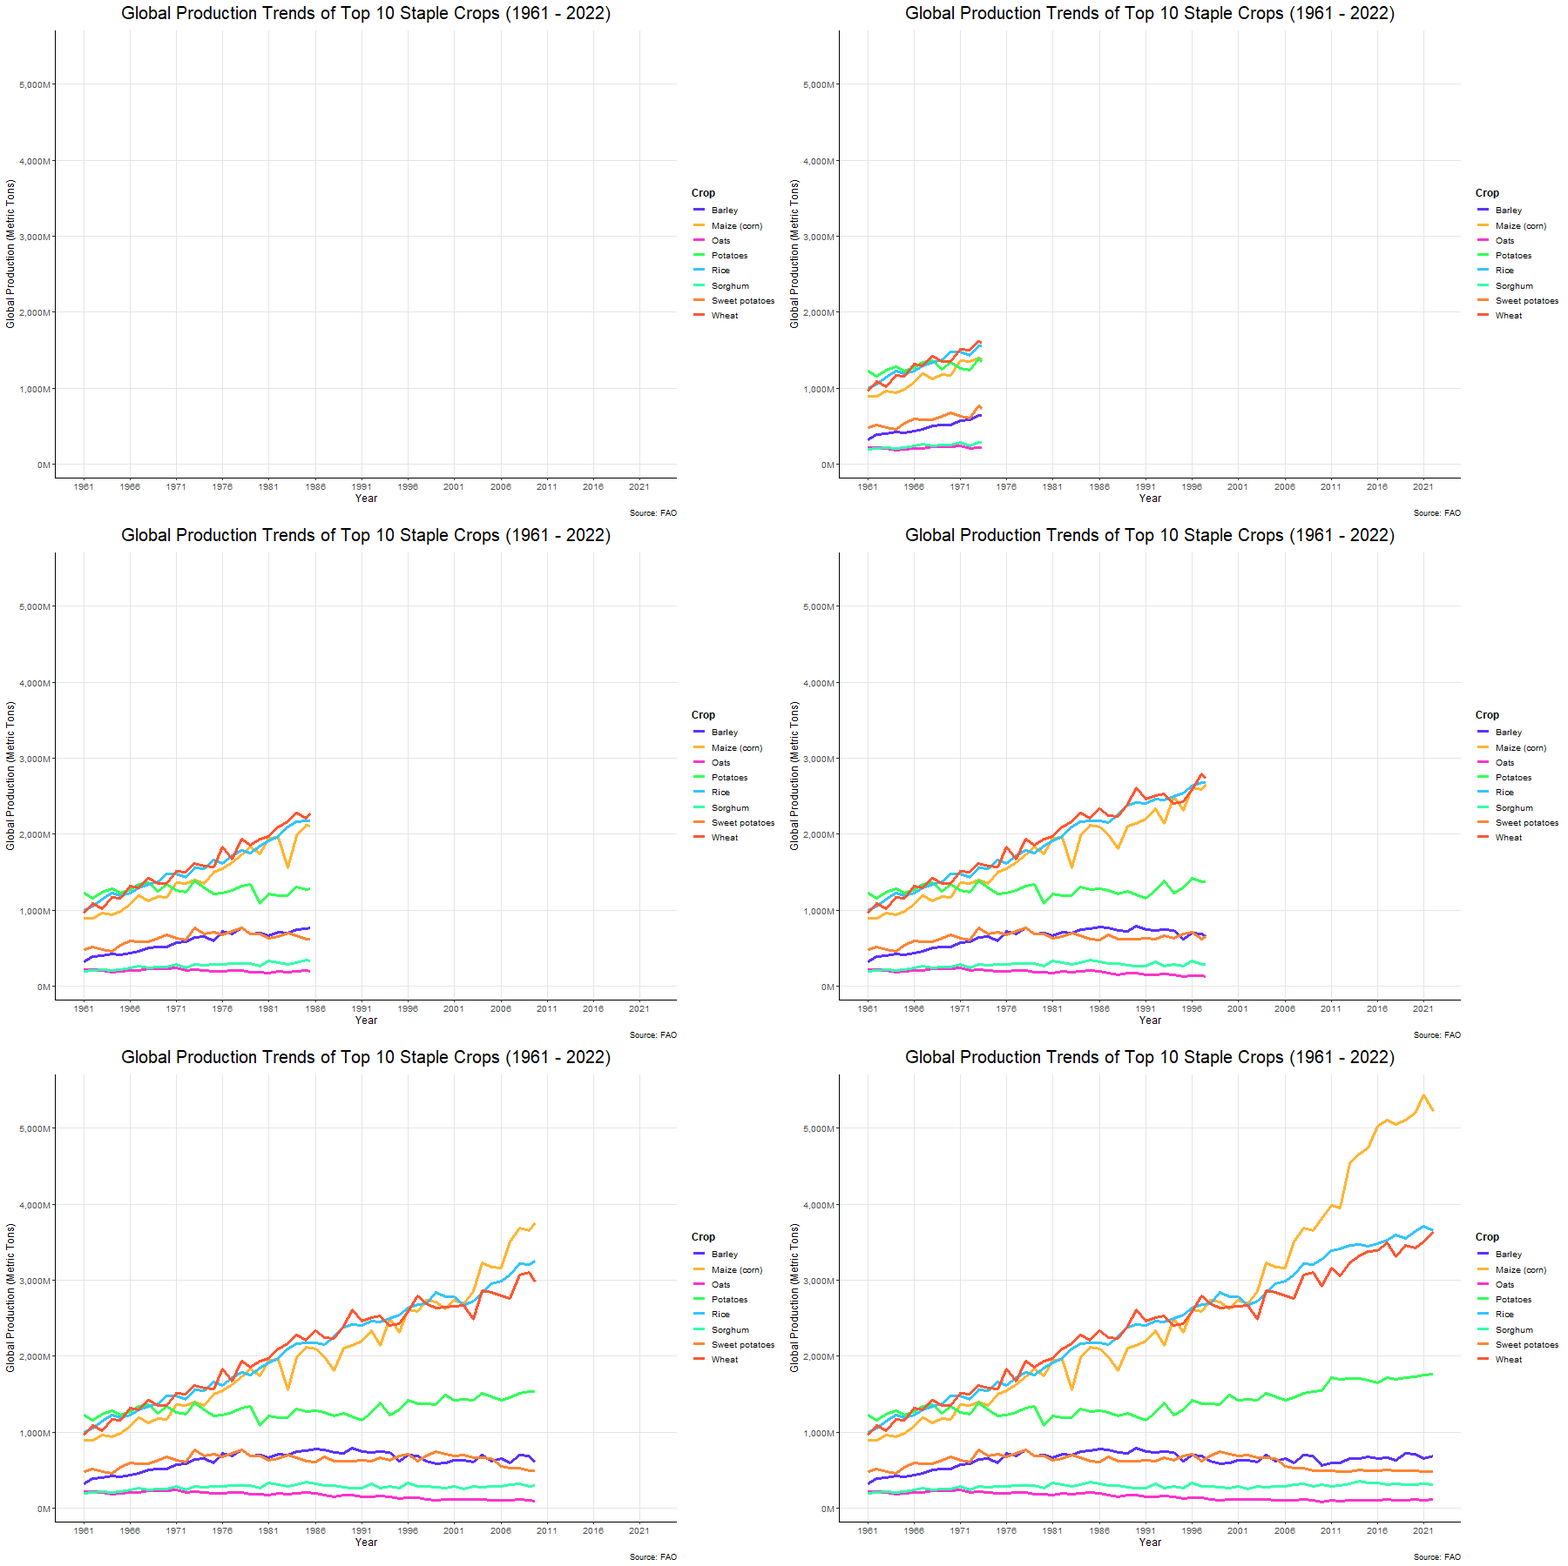
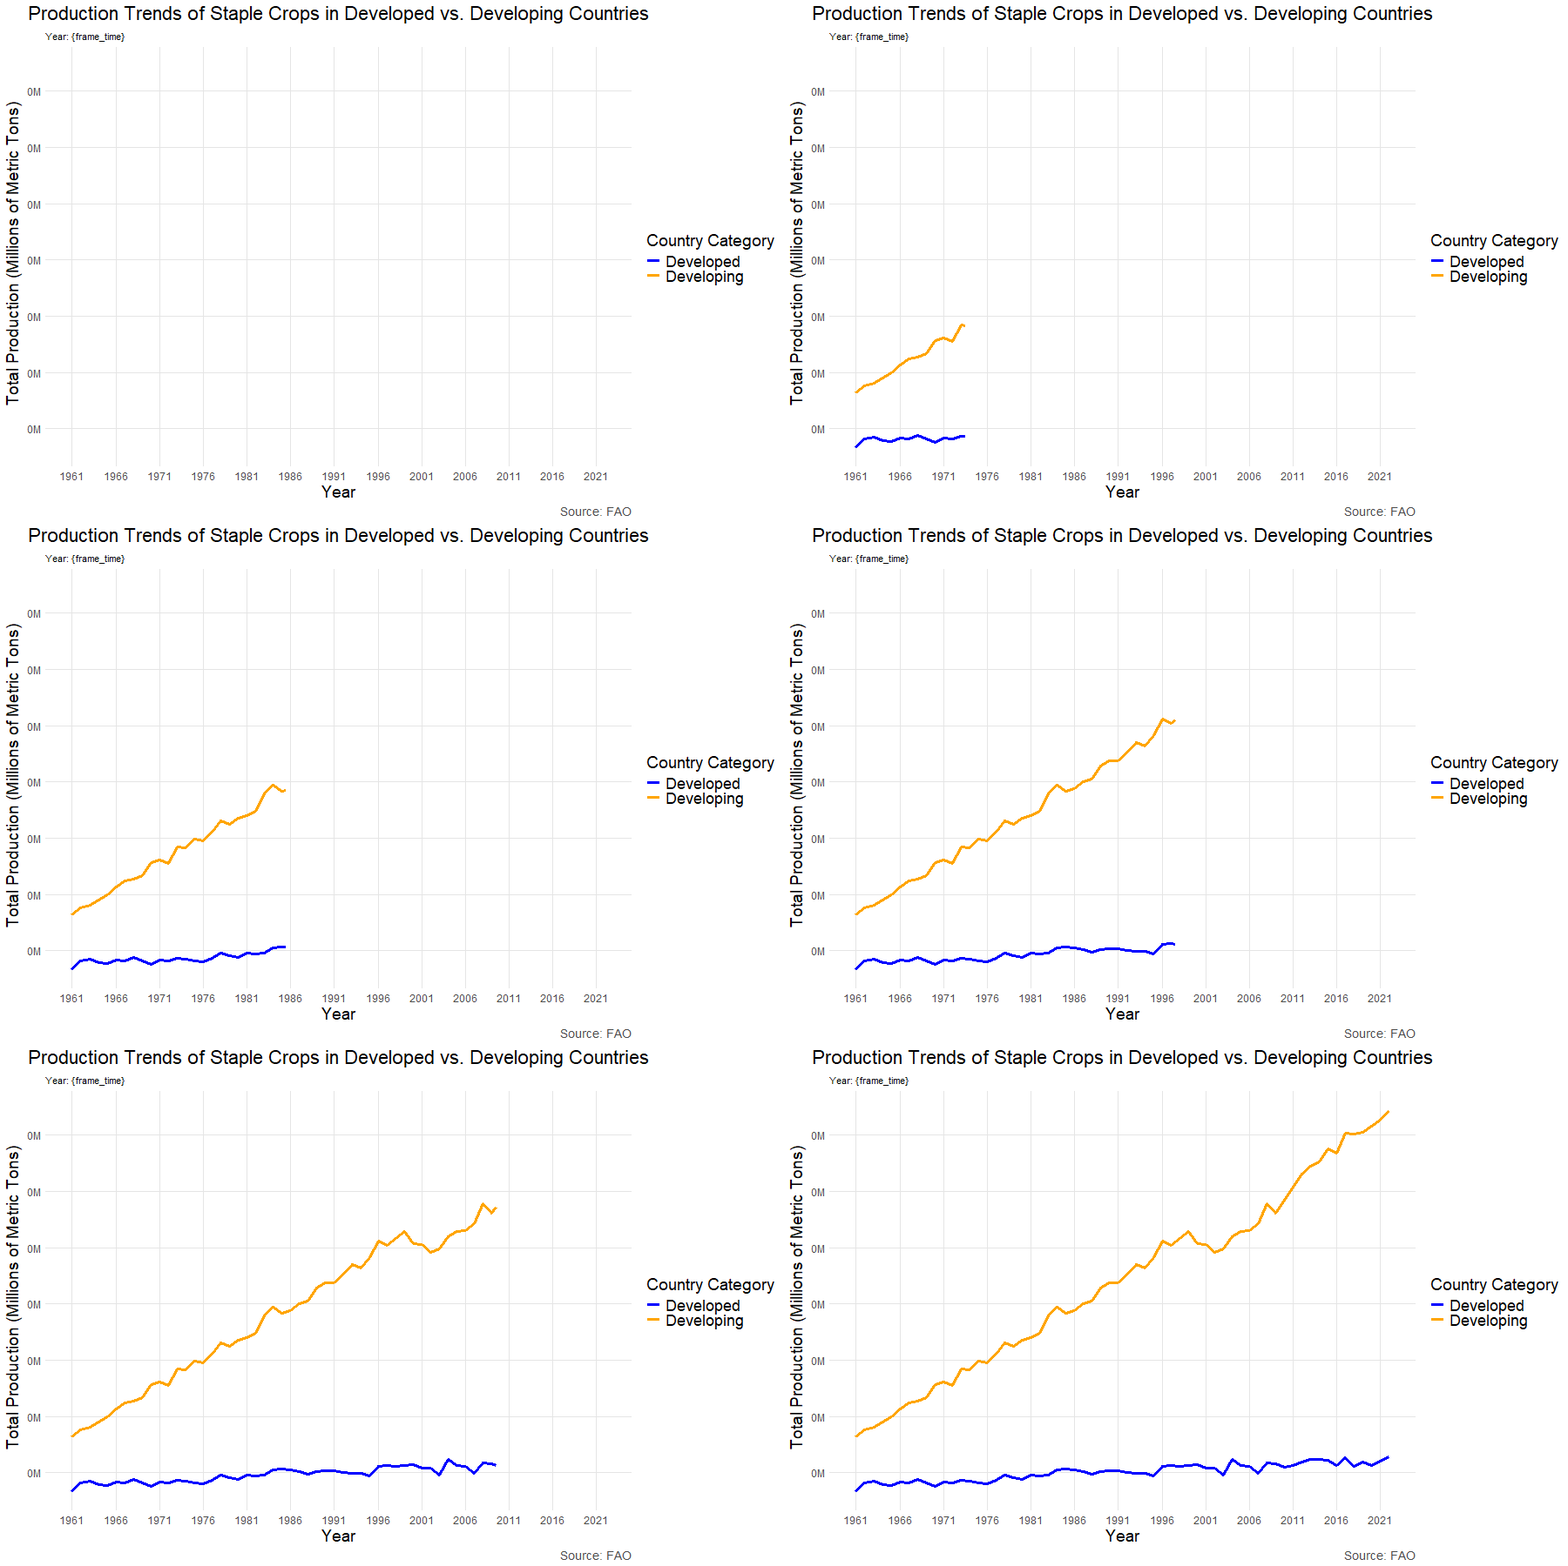
- How has the global production of staple crops changed over the past 50 years, and what are the regional trends in production?


Visualization: This area chart displays production trends for individual livestock commodities, such as beef, milk, and poultry.
Purpose: Identifies the major contributors to global livestock production and tracks their production evolution over time.
Key Features: Stacked area layers highlight the proportion and changes in production volumes for each commodity.
Conclusion
The global production of the top staple crops has increased significantly over years, with developing countries showing rapid growth compared to the stable yields in developed nations.
Livestock production has steadily grown globally, with rising demand for protein-rich foods leading to notable increases in key commodities such as Milk, beef and poultry.